Configuring VS Code
Getting the program compiling and running in the terminal will mean that you now know the steps an editor like Visual Studio Code would need to automate for us.
Visual Studio Code uses extensions to extend its capabilities to support developers working in a range of languages. To get support with C/C++ we need to install the associated extensions and then configure their settings to get them to link in the required libraries.
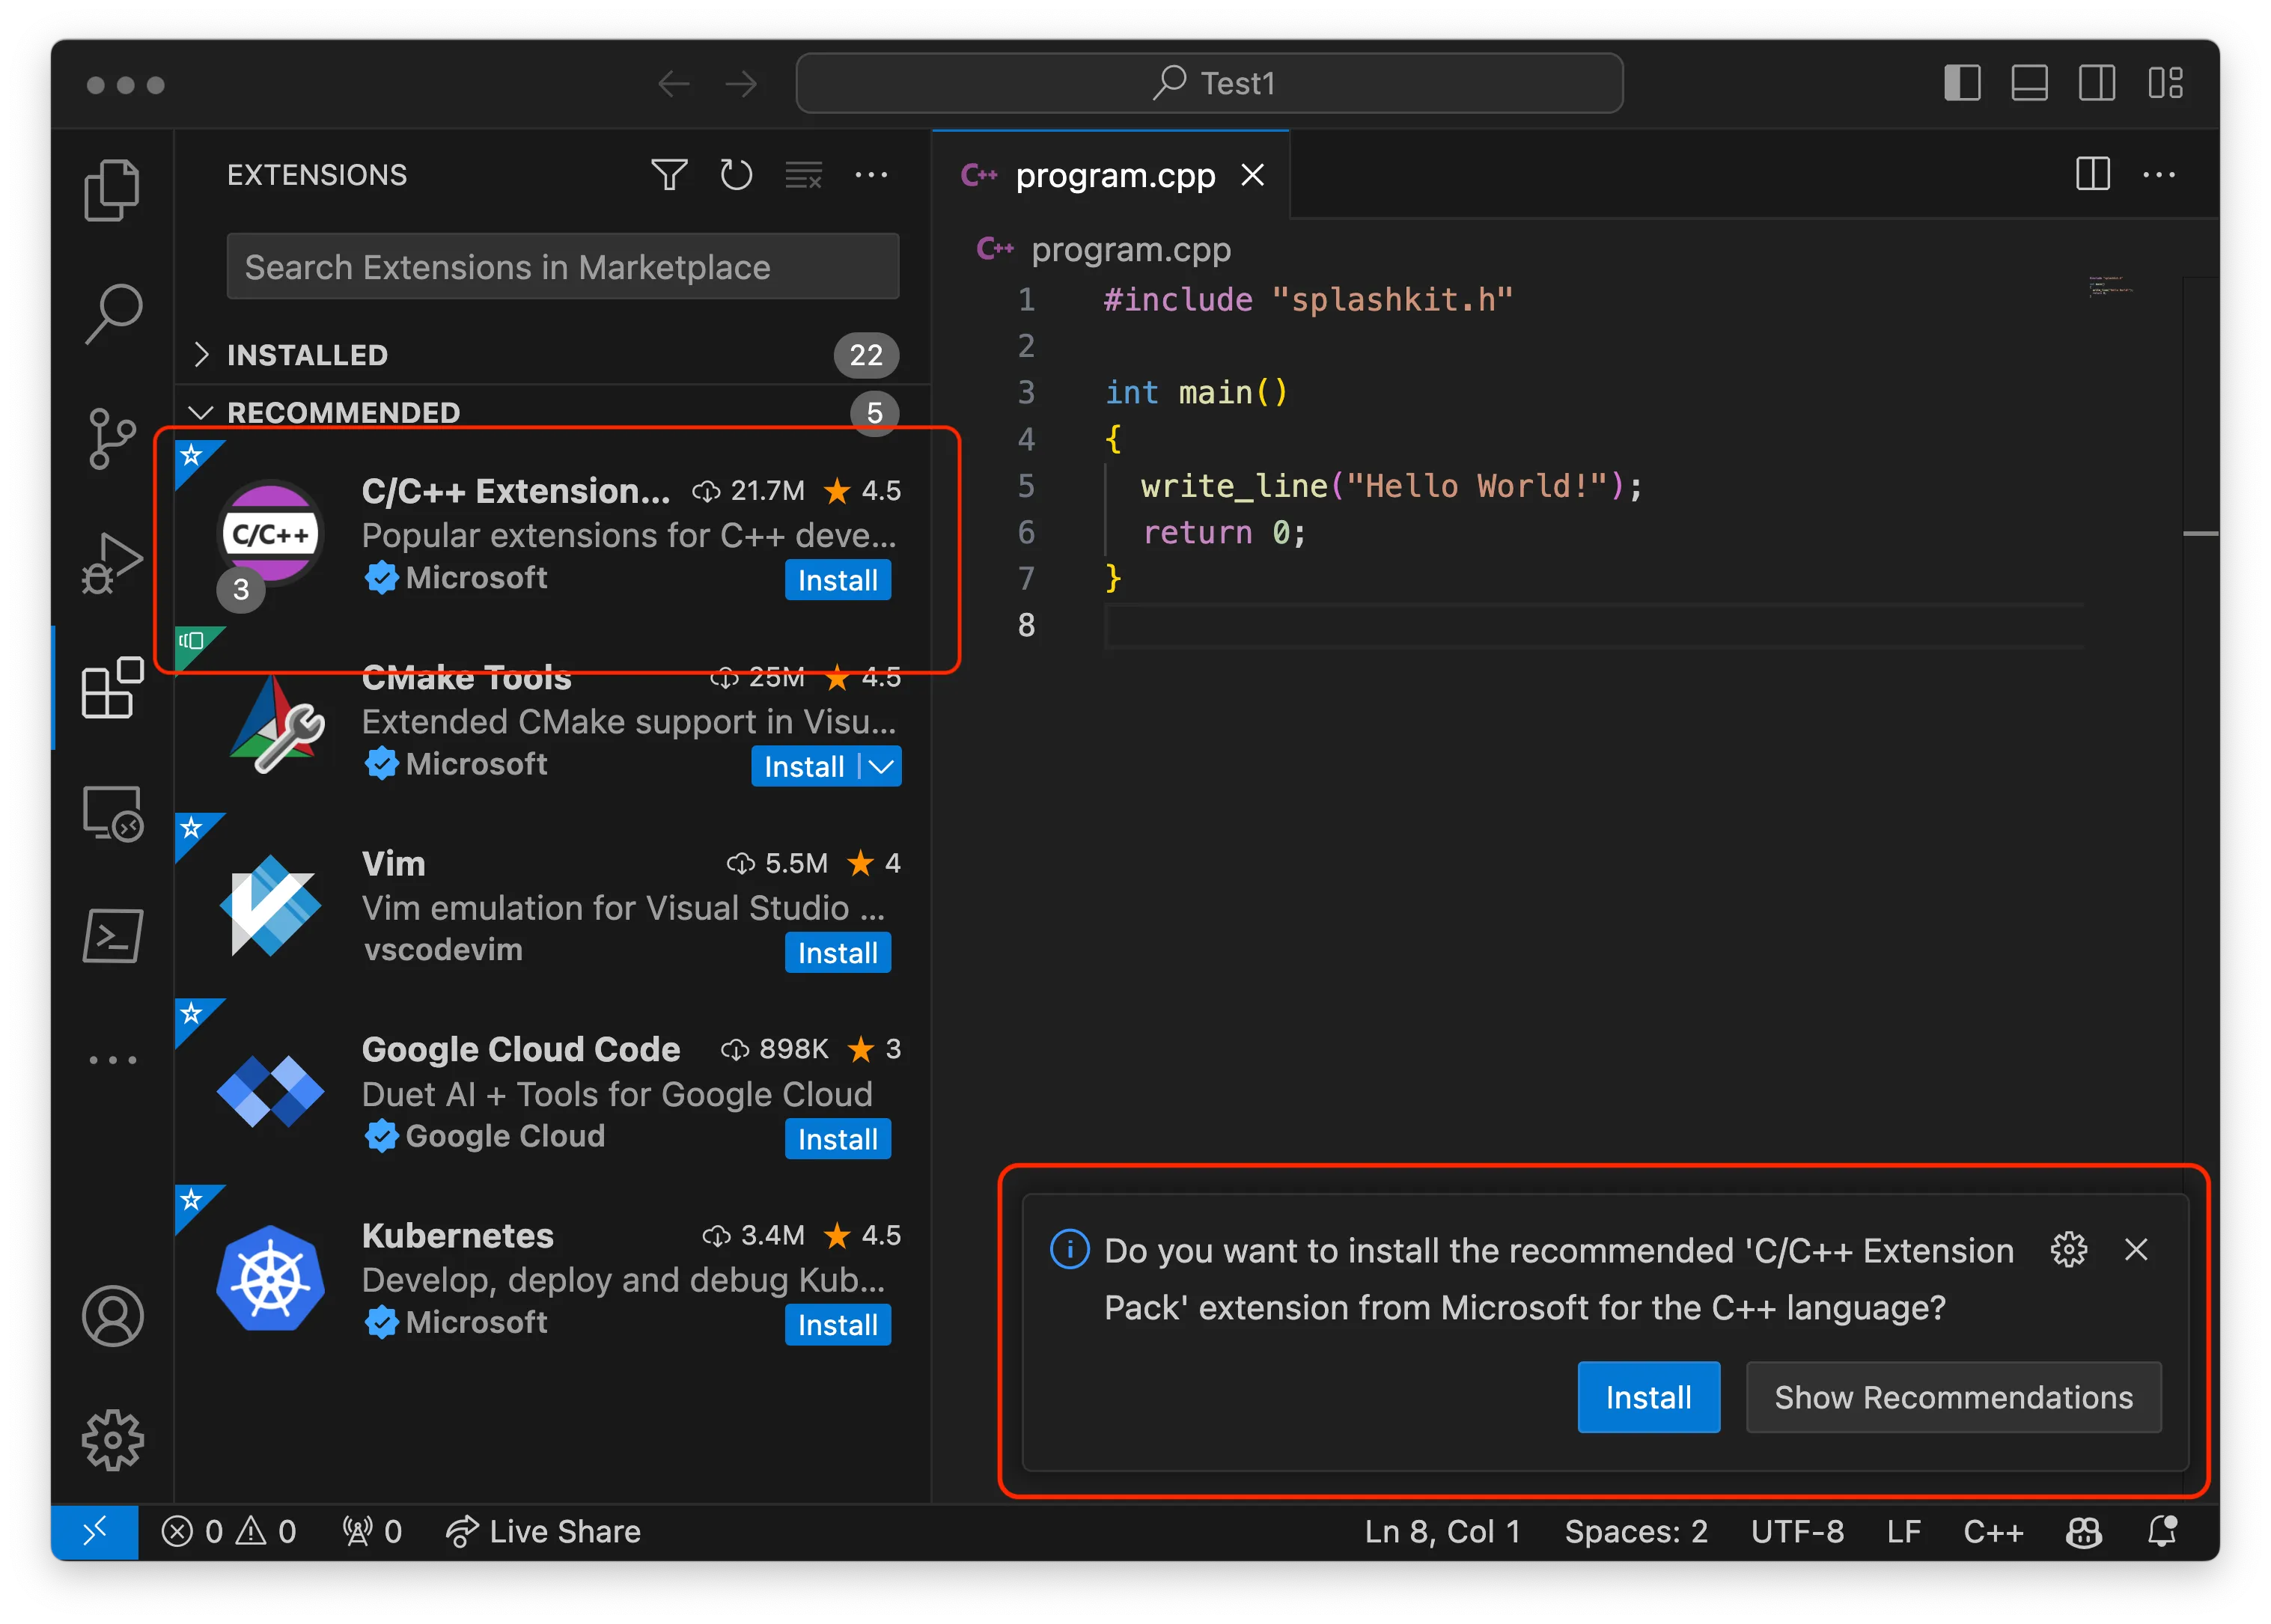
The extension you need to install is called the C/C++ Extension Pack by Microsoft. Visual Studio Code should automatically show you this in the extensions’ pane if you have the program.cpp file open. Click the install button to install this extension in your editor.

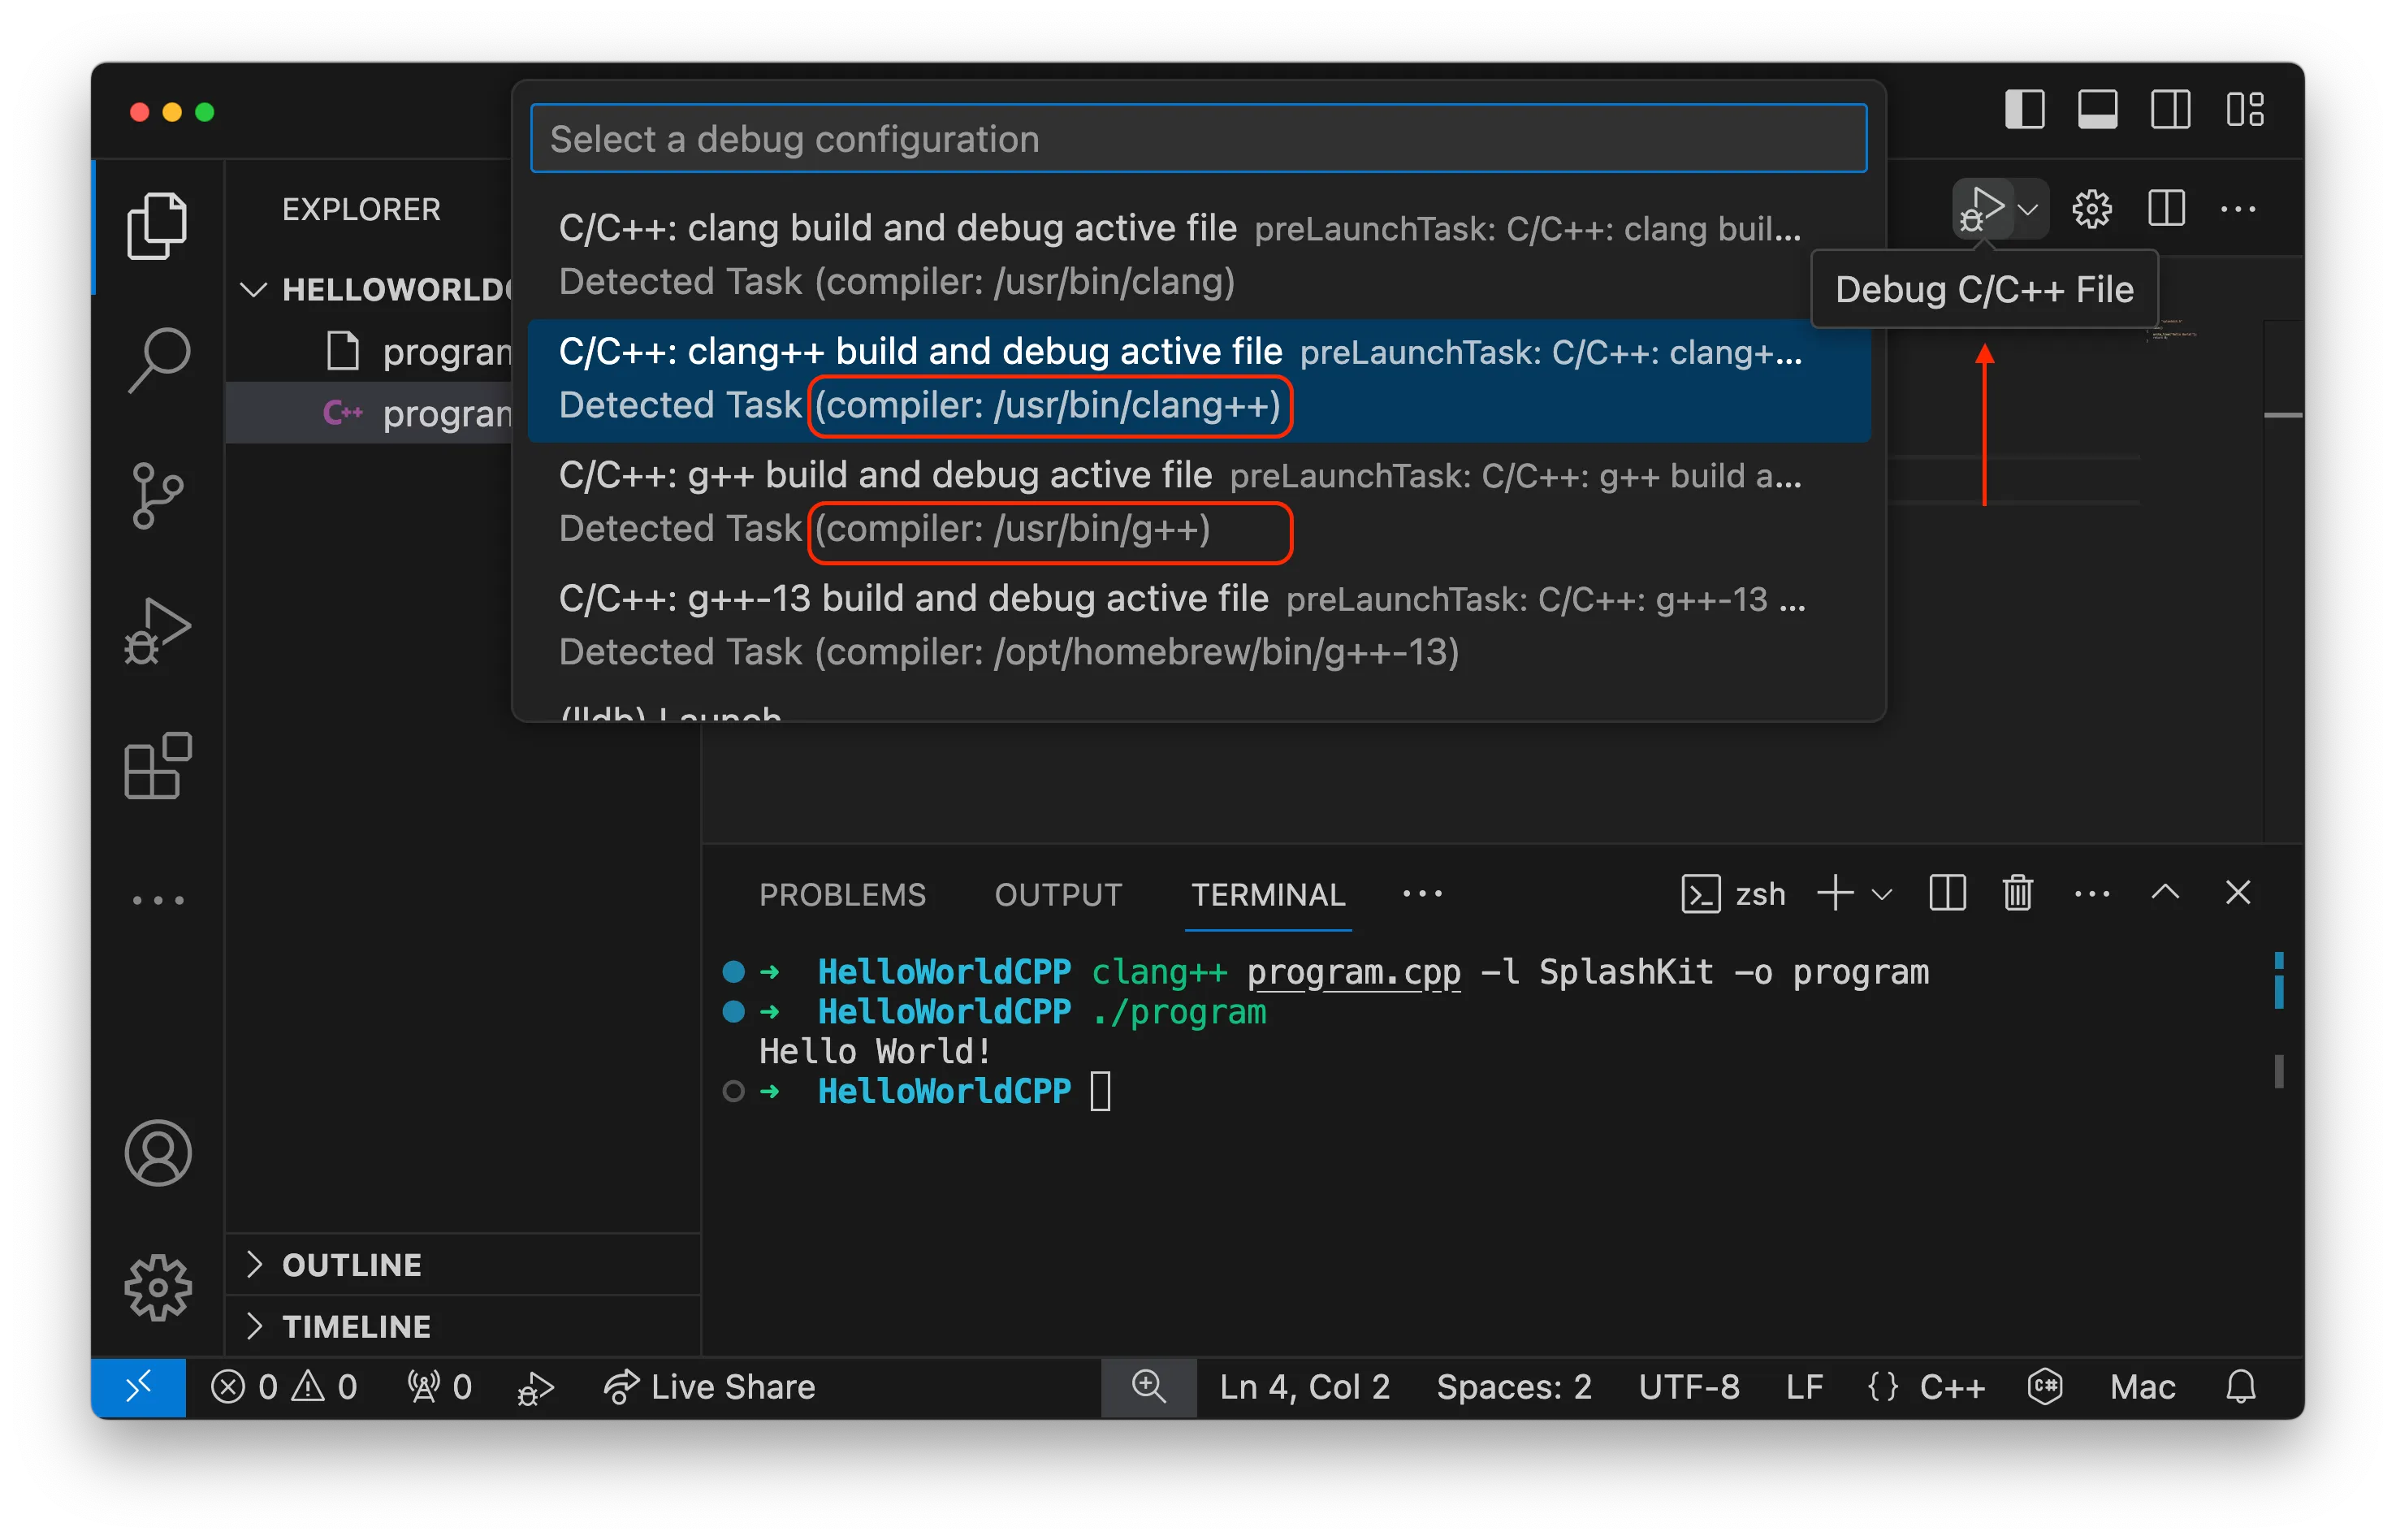
With the extension installed, you now need to add some files to configure this to work with your code. The extension will have added a quick configure button that will help get you started. With your program.cpp file selected, click the debug/play icon near the top right of the window as highlighted in the following image. This button can be used to compile and run your program.
When you click the debug/play icon, it will open a prompt where you can select the compiler you want to use. You can choose either the g++ or the clang++ compiler. While the clang compiler is our preferred compiler, it is newer and isn’t yet fully integrated into VS Code across all platforms. As a result, you will need to use g++ and its debugger (gdb) on Linux and Windows. On macOS, you should use clang++ and its debugger (lldb).
The image below shows the options on macOS. This lists both the clang++ and g++ compiler options. Select the appropriate option based on the operating system you are using.

This will create a tasks.json files in a hidden .vscode folder, and will then attempt to build your program. At the moment, this will fail as we need to tell the compiler to link in the SplashKit library. You should get an error as shown in the image below. Click the Abort or the Show Errors button, and then you can adjust the settings to get this to compile. You should be able to see the error message in the Terminal, so you can check what went wrong there.

Configuring the Build Task
The tasks.json file contains various settings related to compiling the program, as shown below. We need to provide this with the additional options we provided to the compiler when we compiled our program through the terminal. The args setting is a list of the values to pass as arguments to the compiler. You need to extend this with extra options to link the SplashKit library as shown below.
Example tasks.json Code
{ "tasks": [ { "type": "cppbuild", "label": "C/C++: clang++ build active file", "command": "/usr/bin/clang++", "args": [ "-fcolor-diagnostics", "-fansi-escape-codes", "-g", "${file}", "-l", // add the -l switch "SplashKit", // followed by the SplashKit library "-o", "${fileDirname}/${fileBasenameNoExtension}" ], "options": { "cwd": "${fileDirname}" }, "problemMatcher": [ "$gcc" ], "group": { "kind": "build", "isDefault": true }, "detail": "Task generated by Debugger." } ], "version": "2.0.0"}{ "tasks": [ { "type": "cppbuild", "label": "C/C++: g++ build active file", "command": "/usr/bin/g++", "args": [ "-fdiagnostics-color=always", "-g", "${file}", "-l", // add the -l switch "SplashKit", // followed by the SplashKit library "-o", "${fileDirname}/${fileBasenameNoExtension}" ], "options": { "cwd": "${fileDirname}" }, "problemMatcher": [ "$gcc" ], "group": { "kind": "build", "isDefault": true }, "detail": "Task generated by Debugger." } ], "version": "2.0.0"}{ "tasks": [ { "type": "cppbuild", "label": "C/C++: g++ build active file", "command": "/usr/bin/g++", "args": [ "-fdiagnostics-color=always", "-g", "${file}", "-l", // add the -l switch "SplashKit", // followed by the SplashKit library "-o", "${fileDirname}/${fileBasenameNoExtension}" ], "options": { "cwd": "${fileDirname}" }, "problemMatcher": [ "$gcc" ], "group": { "kind": "build", "isDefault": true }, "detail": "Task generated by Debugger." } ], "version": "2.0.0"}{ "tasks": [ { "type": "cppbuild", "label": "C/C++: g++.exe build active file", "command": "C:\\msys64\\mingw64\\bin\\g++.exe", "args": [ "-fdiagnostics-color=always", "-g", "${file}", "-l", // add the -l switch "SplashKit", // followed by the SplashKit library "-o", "${fileDirname}\\${fileBasenameNoExtension}.exe" ], "options": { "cwd": "${fileDirname}" }, "problemMatcher": [ "$gcc" ], "group": { "kind": "build", "isDefault": true }, "detail": "Task generated by Debugger." } ], "version": "2.0.0"}Each argument is added as a separate string within quotes, separated by commas. So, we added the following lines to our tasks.json:
"-l", "SplashKit",These settings tell VS Code how to build a selected C++ file that uses the SplashKit library. With your program.cpp file selected (i.e. open and with the cursor in it) you can build the program using ctrl-shift-b (cmd-shift-b on macOS) or selecting Tasks: Run Build Task from the command palette.
In the terminal window in VS Code you should see the output from this, as shown below. Make sure that you can see that this ran successfully.
 *  Executing task: C/C++: clang++ build active file
Starting build.../usr/bin/clang++ -std=gnu++14 -fcolor-diagnostics -fansi-escape-codes -g /Users/omckeon/Documents/Code/HelloWorldCPP/program.cpp -l SplashKit -o /Users/omckeon/Documents/Code/HelloWorldCPP/program
Build finished successfully. *  Terminal will be reused by tasks, press any key to close it.
In the DEBUG CONSOLE tab, you will see libraries loaded in yellow text, and then you should see the following lines in blue text:
=thread-selected,id="1"Hello World! * Executing task: C/C++: g++ build active file
Starting build.../usr/bin/g++ -fdiagnostics-color=always -g /home/livmc/Code/HelloWorldCPP/program.cpp -l SplashKit -o /home/livmc/Code/HelloWorldCPP/program
Build finished successfully.* Terminal will be reused by tasks, press any key to close it.Hello World![1] + Done "/usr/bin/gdb" --interpreter=mi --tty=${DbgTerm} 0<"/tmp/Microsoft-MIEngine-In-gj3j1ywi.4j1" 1>"/tmp/Microsoft-MIEngine-Out-3urnj5n0.tvy" * Executing task: C/C++: g++ build active file
Starting build.../usr/bin/g++ -fdiagnostics-color=always -g /home/livmc/Code/HelloWorldCPP/program.cpp -l SplashKit -o /home/livmc/Code/HelloWorldCPP/program
Build finished successfully.* Terminal will be reused by tasks, press any key to close it.Hello World![1] + Done "/usr/bin/gdb" --interpreter=mi --tty=${DbgTerm} 0<"/tmp/Microsoft-MIEngine-In-gj3j1ywi.4j1" 1>"/tmp/Microsoft-MIEngine-Out-3urnj5n0.tvy" * Executing task: C/C++: g++.exe build active file
Starting build...cmd /c chcp 65001>nul && C:\msys64\mingw64\bin\g++.exe -fdiagnostics-color=always -g C:\Users\livmc\Documents\Code\HelloWorldCPP\program.cpp -l SplashKit -o C:\Users\livmc\Documents\Code\HelloWorldCPP\program.exe
Build finished successfully.* Terminal will be reused by tasks, press any key to close it. /usr/bin/env c:\\Users\\livmc\\.vscode\\extensions\\ms-vscode.cpptools-1.23.6-win32-x64\\debugAdapters\\bin\\WindowsDebugLauncher.exe --stdin=Microsoft-MIEngine-In-nyq1f0zh.3xz --stdout=Microsoft-MIEngine-Out-e553zy1m.x2j --stderr=Microsoft-MIEngine-Error-ubfb1xna.wcx --pid=Microsoft-MIEngine-Pid-uf0vxbjv.nwh --dbgExe=C:\\msys64\\mingw64\\bin\\gdb.exe --interpreter=miHello World!At this point, you have Visual Studio Code set up to build the currently selected file into a program.
Going forward, you can edit the tasks.json to compile multiple files. To do this you need to change the argument that passes in what to compile, and the output option in the following ways:
- Change
"${file}"to"*.cpp". This will then compile all cpp files. - The “-o” argument is followed by the name of the program to create. This is currently
"${fileDirname}/${fileBasenameNoExtension}"(or"${fileDirname}\\${fileBasenameNoExtension}.exe"for MSYS2/MINGW64), which names the program after the selected file. When building multiple files you can provide a fixed value here like “program”. This will then always build the same output regardless of which source file is selected.
Configuring Launch
If you have your computer setup correctly, you should not need to configure the way VS Code launches the debugger. However, should you need to adjust any of these settings you can. You can create the file manually in the .vscode folder, or click the cog next to the debug/play button and select the compiler you selected previously. Using the cog button will create an empty launch.json file (and will also create tasks.json if that does not exist). You use the launch.json file to configure how to run your program.
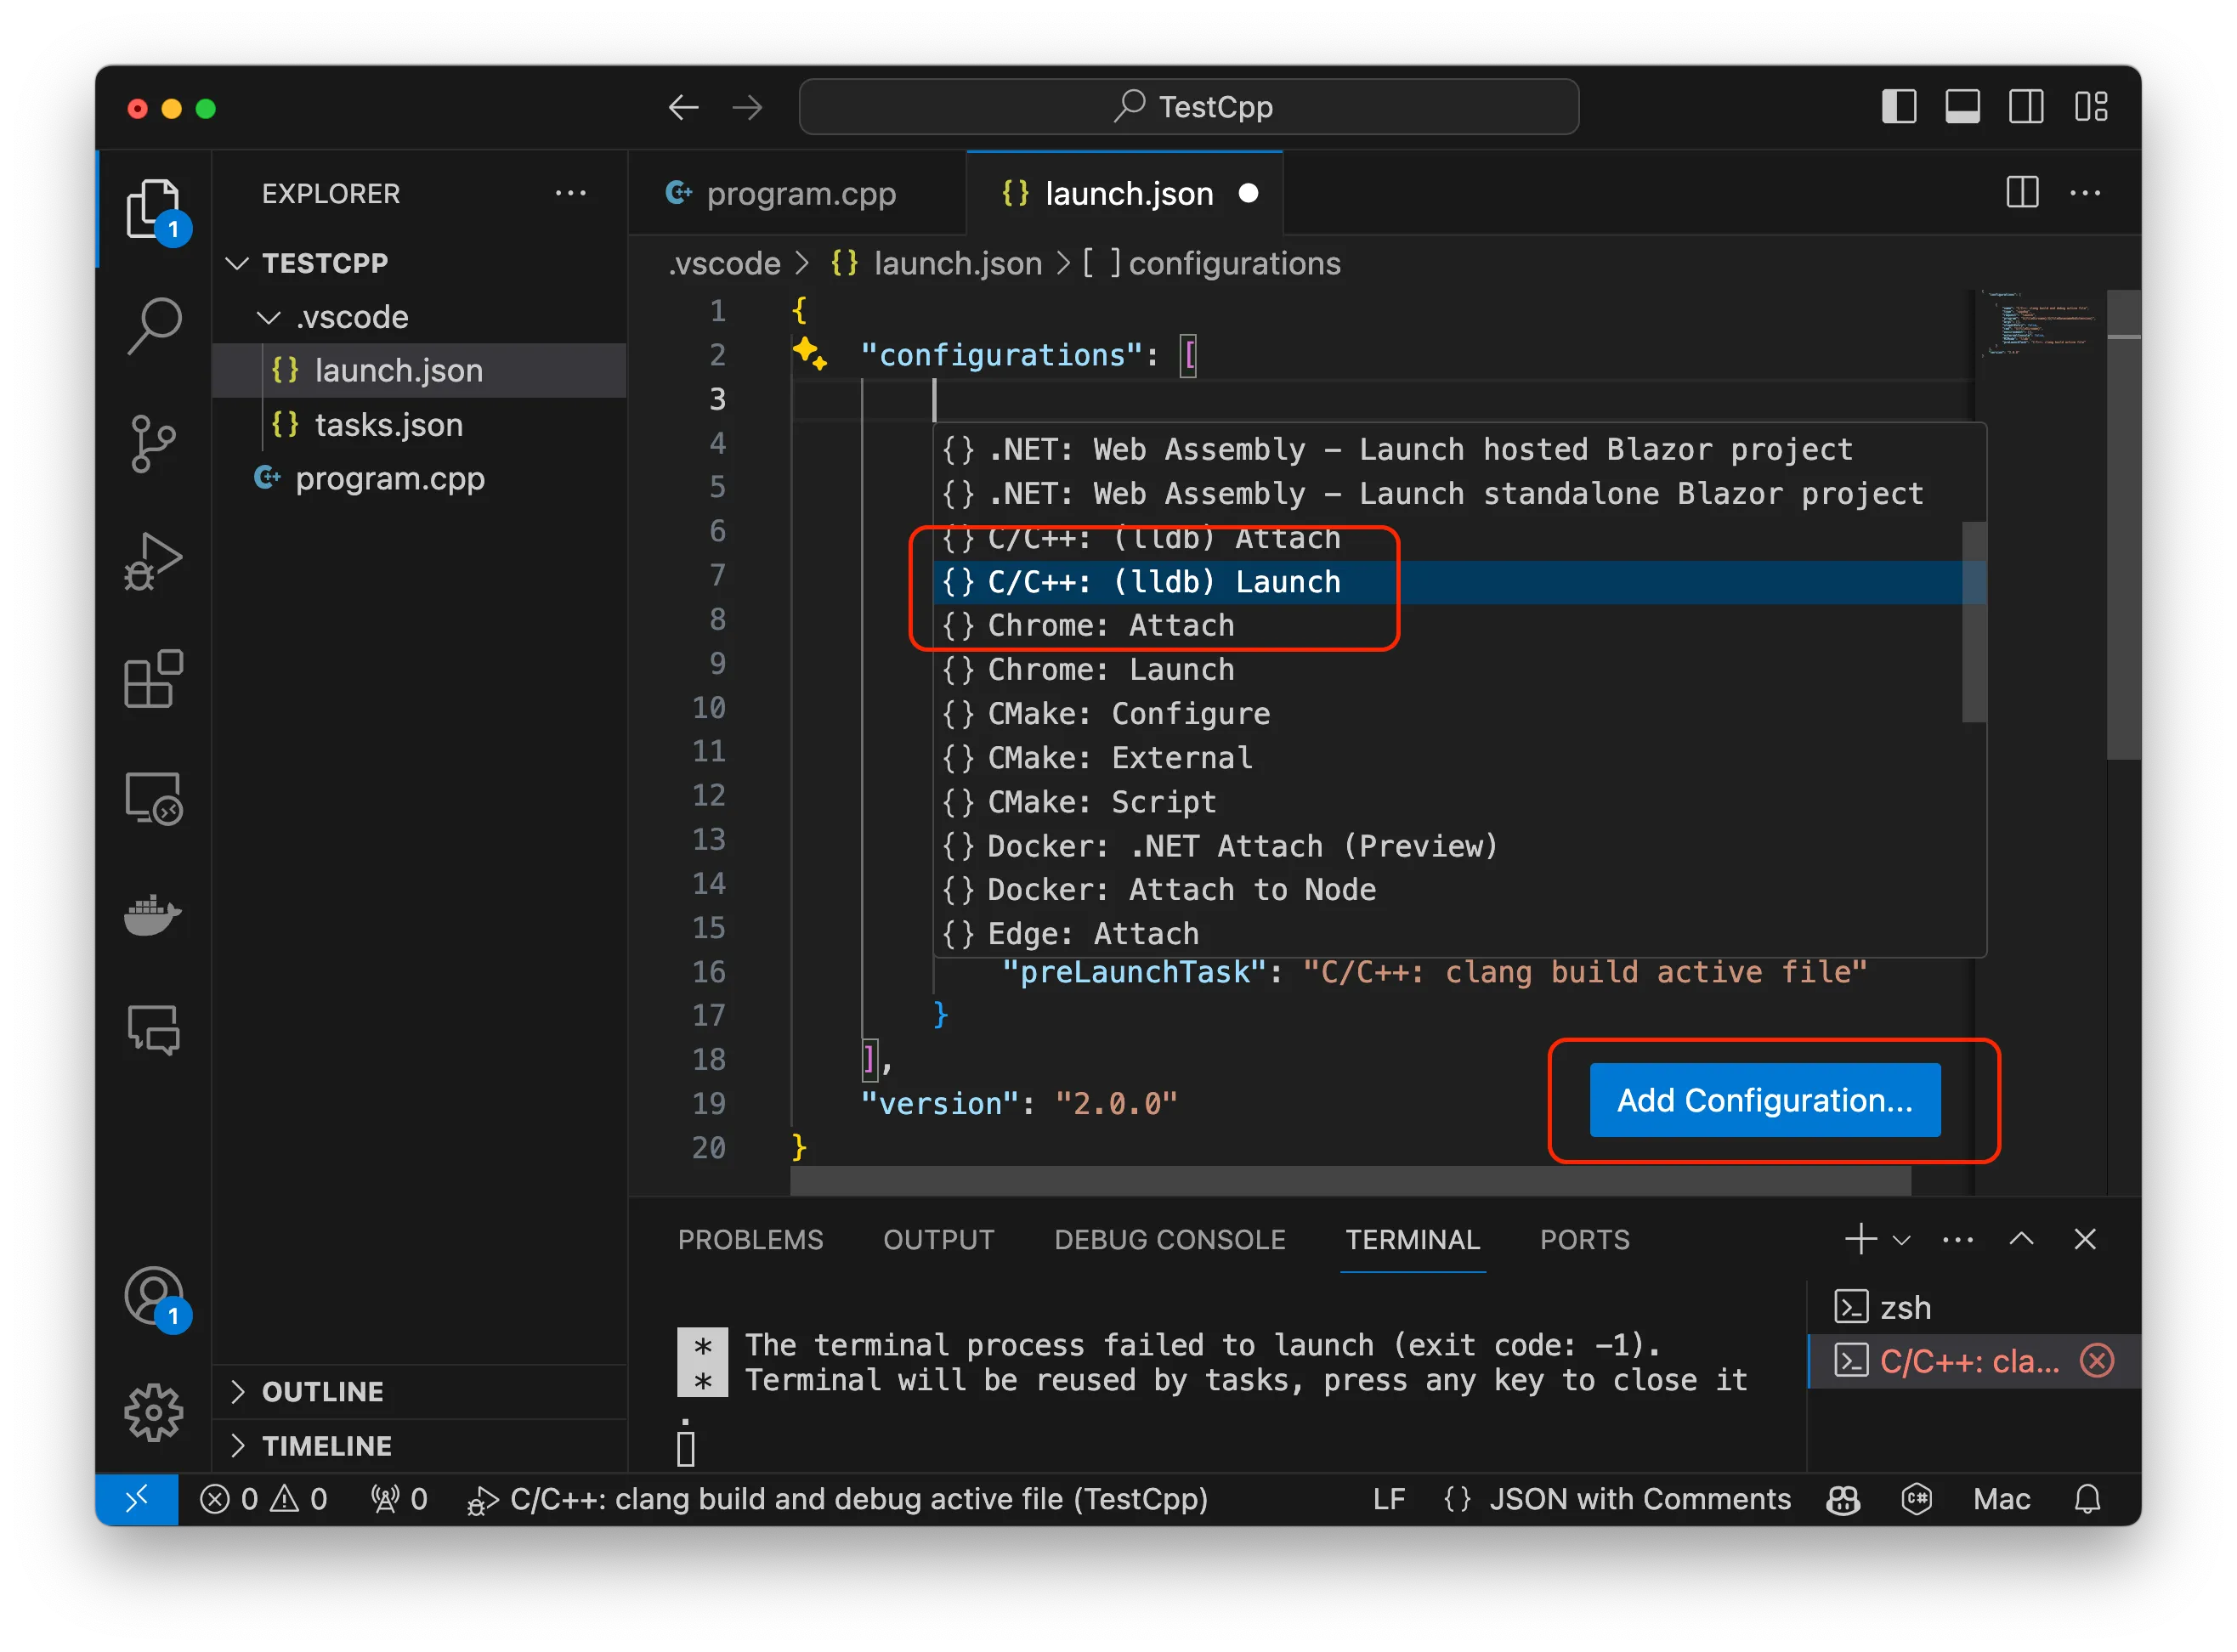
Configuring VS Code to run your C/C++ program is much simpler than configuring the settings needed for compiling. When you open the launch.json it may have defaults already included, which are likely to be ok. If not, you click the Add Configuration button and select the appropriate C/C++ option to launch the program using the debugger. In the image below we have selected to launch with lldb, but you shuld choose gdb if you are using Windows and Linux.

We have an example configuration using gdb below. The important settings to check are the program setting - which should have the same details as you set in the output option of the compiler.
Example launch.json Code
{ "configurations": [ { "name": "C/C++: clang++ build and debug active file", "type": "cppdbg", "request": "launch", "program": "${fileDirname}/${fileBasenameNoExtension}", "args": [], "stopAtEntry": false, "cwd": "${fileDirname}", "environment": [], "externalConsole": false, "MIMode": "lldb", "preLaunchTask": "C/C++: clang++ build active file" } ], "version": "2.0.0"}{ "configurations": [ { "name": "C/C++: g++ build and debug active file", "type": "cppdbg", "request": "launch", "program": "${fileDirname}/${fileBasenameNoExtension}", "args": [], "stopAtEntry": false, "cwd": "${fileDirname}", "environment": [], "externalConsole": false, "MIMode": "gdb", "setupCommands": [ { "description": "Enable pretty-printing for gdb", "text": "-enable-pretty-printing", "ignoreFailures": true }, { "description": "Set Disassembly Flavor to Intel", "text": "-gdb-set disassembly-flavor intel", "ignoreFailures": true } ], "preLaunchTask": "C/C++: g++ build active file" } ], "version": "0.2.0"}{ "configurations": [ { "name": "C/C++: g++ build and debug active file", "type": "cppdbg", "request": "launch", "program": "${fileDirname}/${fileBasenameNoExtension}", "args": [], "stopAtEntry": false, "cwd": "${fileDirname}", "environment": [], "externalConsole": false, "MIMode": "gdb", "setupCommands": [ { "description": "Enable pretty-printing for gdb", "text": "-enable-pretty-printing", "ignoreFailures": true }, { "description": "Set Disassembly Flavor to Intel", "text": "-gdb-set disassembly-flavor intel", "ignoreFailures": true } ], "preLaunchTask": "C/C++: g++ build active file" } ], "version": "0.2.0"}{ "configurations": [ { "name": "C/C++: g++ build and debug active file", "type": "cppdbg", "request": "launch", "program": "${fileDirname}\\${fileBasenameNoExtension}.exe", "args": [], "stopAtEntry": false, "cwd": "${fileDirname}", "environment": [], "externalConsole": false, "MIMode": "gdb", "miDebuggerPath": "C:\\msys64\\mingw64\\bin\\gdb.exe", "setupCommands": [ { "description": "Enable pretty-printing for gdb", "text": "-enable-pretty-printing", "ignoreFailures": true }, { "description": "Set Disassembly Flavor to Intel", "text": "-gdb-set disassembly-flavor intel", "ignoreFailures": true } ], "preLaunchTask": "C/C++: g++.exe build active file" } ], "version": "2.0.0"}Running in the Debugger
To run your code in the debugger, use the “debug/play” or click the “Run and Debug” icon in the debugger pane. You should be able to add breakpoints and step through the code as before.
Notice that unlike C#, the output does not go into the terminal window. To include terminal input and output, you need to change the “externalConsole” setting to false. When you run the debugger now, it will open the default terminal program and allow you to use it for input and output.
Remember, if you change the “-o” setting in tasks.json, you will also need to change it in launch.json.
Video Walkthrough
In this video we’ll step through how to set up compiling and debugging C++ in VS Code.