Debugging
There have always been challenges in getting computers to do what we want. At one stage, computers were large electrical devices filling rooms. During early work on these computers, a moth was found stuck in a relay and Admiral Grace Hopper coined the term debugging as the process of fixing this issue. The term has stuck, and issues in our programs are known as bugs and we still use debugging to describe the process of finding and removing them.
Programming languages include tools to aid developers in understanding what is happening as the program runs. These tools will be great aids to you as you try to learn about how instructions work within your program. One of the most important tools we will use is the debugger. You can use the debugger to step through your program line by line.

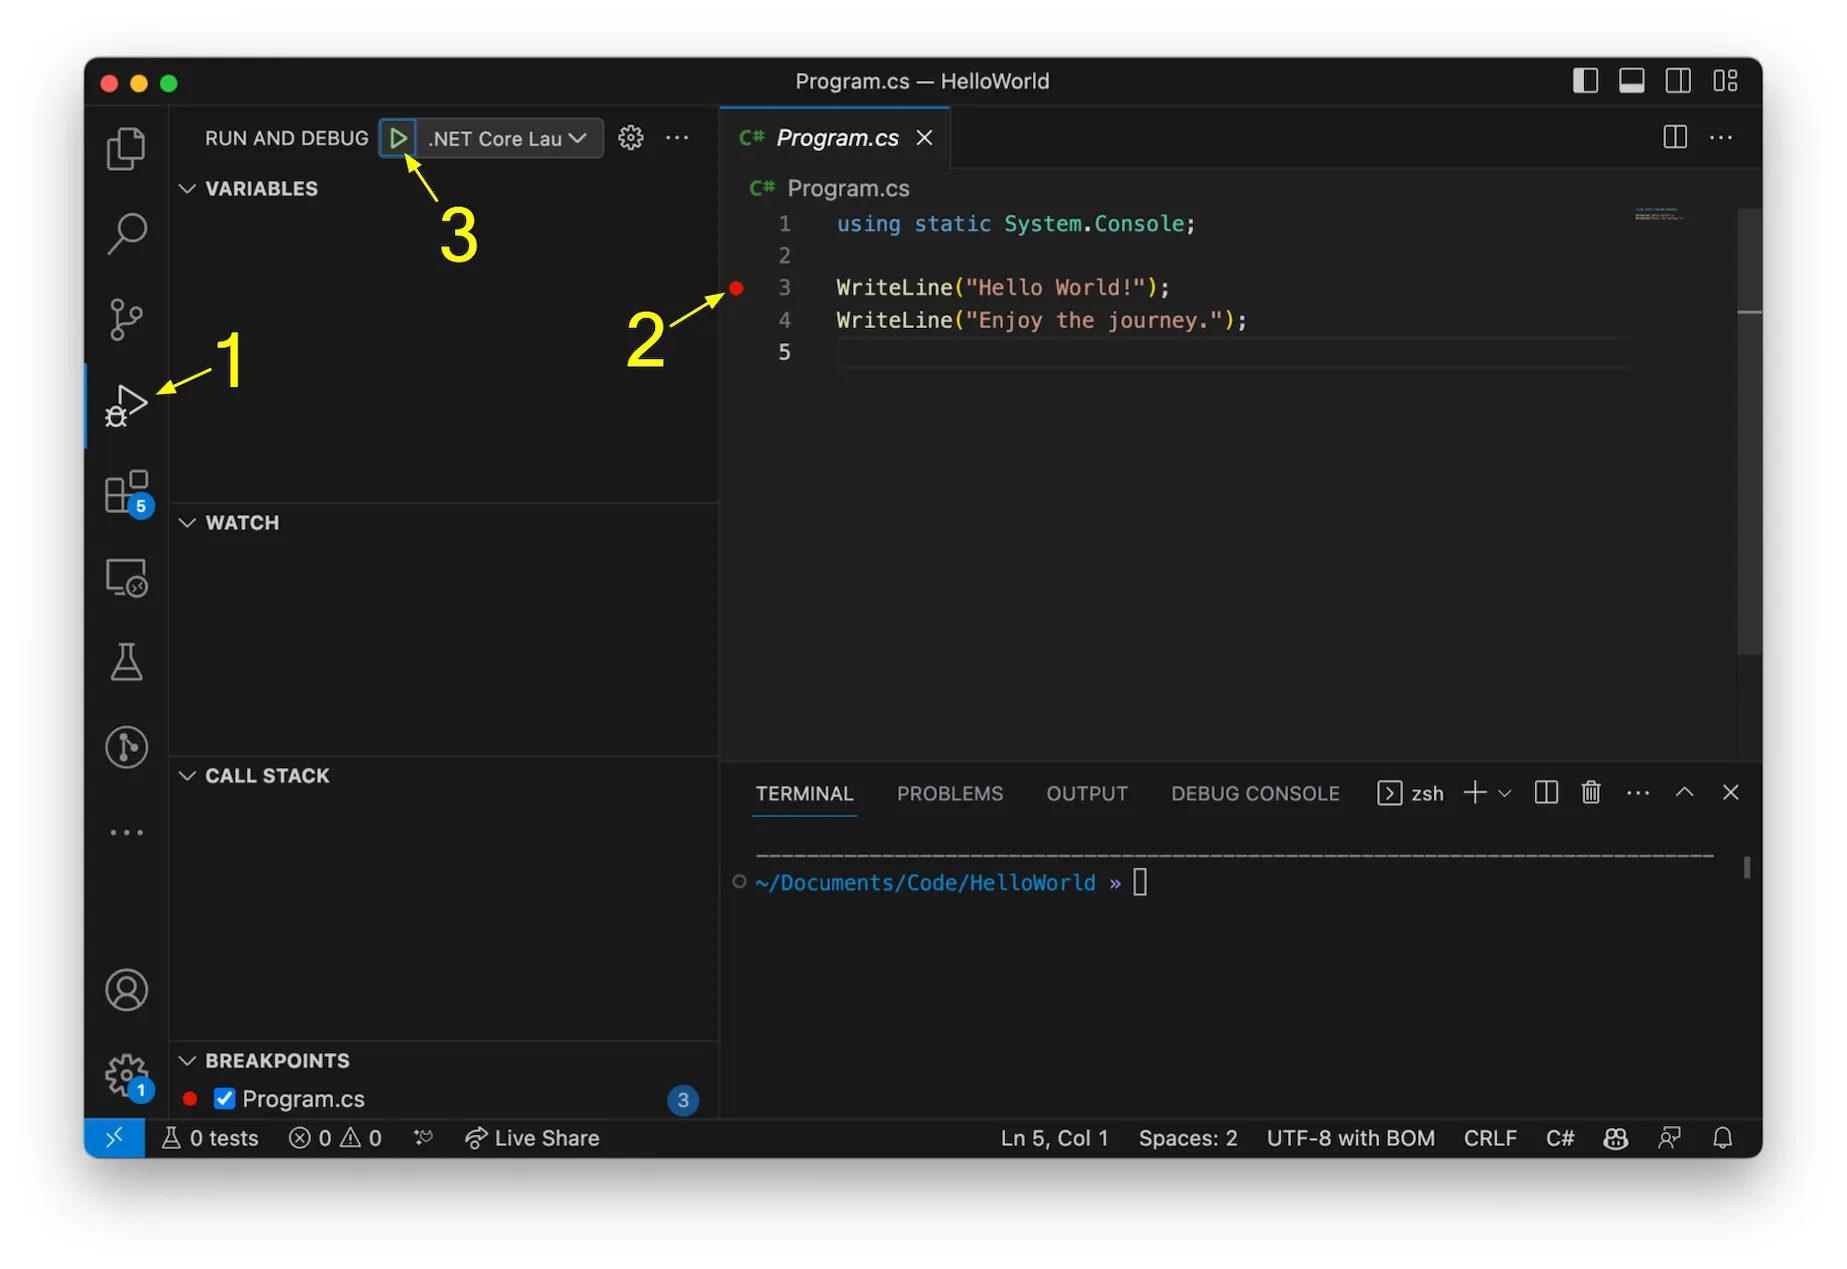
The image above shows the debugger selected in VS Code, with a breakpoint on line 3. The key features are:
- This link in the sidebar allows you to access the debugger.
- Clicking in the area to the left of the line numbers will set a breakpoint on that line. When you add a breakpoint a red dot is added to the left-hand side of the line. The debugger will then break (stop) execution at that point and give control to you.
- The play button gets VS Code to run the command line tools needed to start this, and for it to hook up to the debugging process.
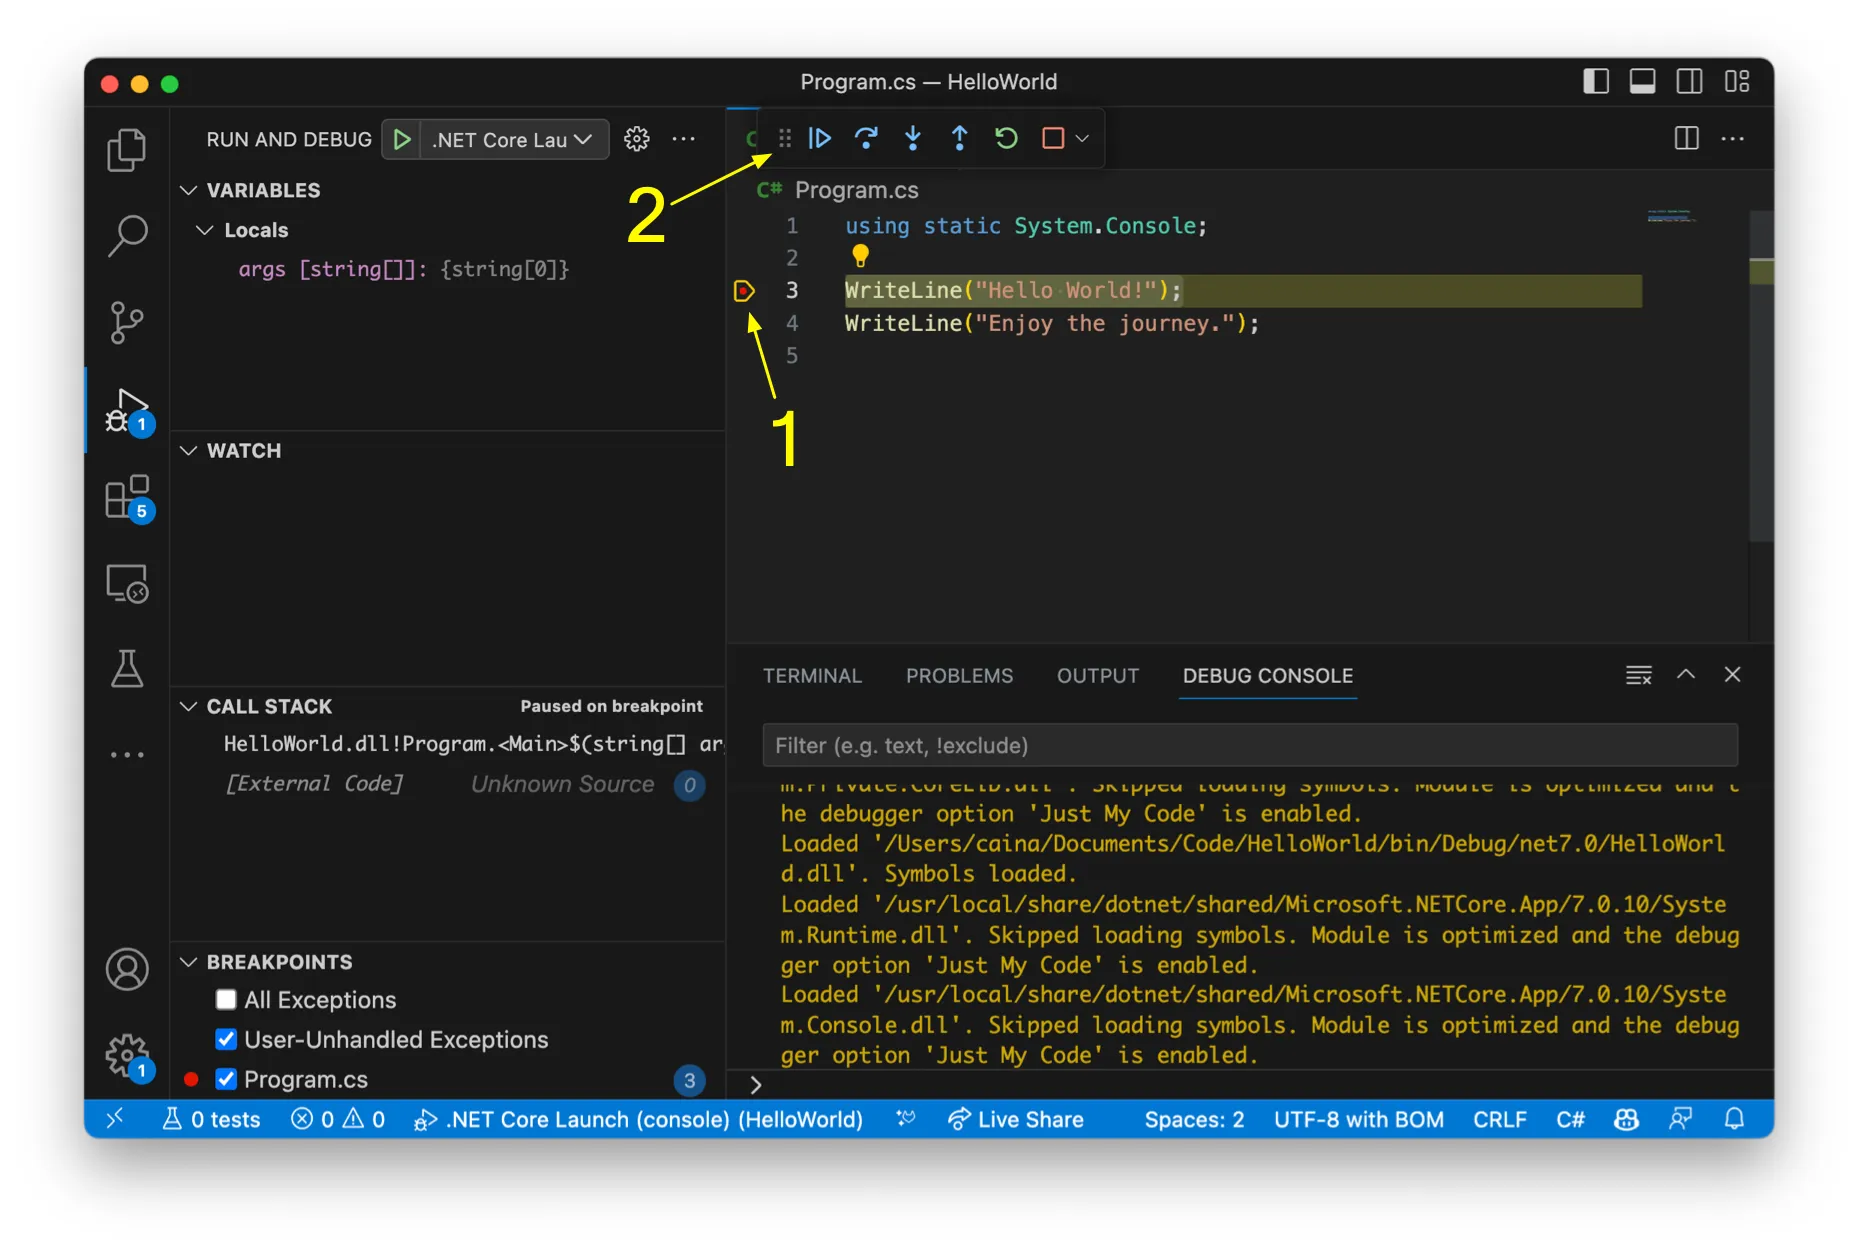
When the debugger runs, VS Code will give you a control panel you can use to step through the program.

- The yellow marker around the breakpoint indicates the current line of code running.
- A new control panel has appeared at the top of the screen with buttons to control execution.

This control panel gives you the power to step through the program as it runs.
- The first play button will continue the execution, only stopping again if another breakpoint is encountered.
- The second button will step-over the current line and move to the next line shown.
- The next two buttons are step-into and step-out, both of which we will explore in Part 2.
- The fifth button is used to restart the program.
- Finally, the last button will stop the program.
When you use the Debugger you can step through the program one line at a time. You can hover over data values, and stop or continue the program when you are done.
Debuggers are great for locating complicated issues and helping you see how a program is running. As you progress, you will get better and better at using it to explore and troubleshoot the code you write.
In the next section we will put these concepts together to build and run a small program, and use the debugger to make sure you have things setup correctly.